Wednesday, May 31, 2006
Americans disapprove of teenage sex as much as extramarital sex (and they really don't like the latter): In light of the discussion over peak age of attractiveness, it is interesting to me how teenage sex is universally condemned in this society. According to the GSS, only 2.7% of respondents think that sex between 14-16 year olds is not wrong. This figure is similar to the 3.8% who feel that extramarital sex is not wrong.
Tuesday, May 30, 2006
Thirteen is the sexiest age? I just read Derbyshire's claim that, based on TangoMan's analysis of rape statistics, the peak age for female sexual attractiveness is 12-14. It seems to me that this age range is distorted downward by the fact that children will be overrepresented in rape statistics because when children have any sexual experiences with an adult, it is by definition rape. Adult-adult sex can be consensual--by legal and conventional definition, adult-child sex cannot. The average age of rape is also low because one important contributing factor is vulnerability, and because some rapes may be motivated by factors other than sexual attraction--other factors associated with childhood, such as immaturity.
Does anyone have other kinds of evidence relevant to this issue? One idea I had was to google the terms "barely 18" and "college girls" to get an idea if attraction would be tilted younger or older. The numbers were 479,000 and 3.3 million, respectively.
Does anyone have other kinds of evidence relevant to this issue? One idea I had was to google the terms "barely 18" and "college girls" to get an idea if attraction would be tilted younger or older. The numbers were 479,000 and 3.3 million, respectively.
There are no atheists in foxholes...or out of foxholes for that matter: Steve Sailer and a reader raised the issue of belief in God in the military. The GSS asked respondents if they believed in God, and also asked about years of military service. For those who have served, the percent who do not believe in God is 2.2%. The corresponding number for those never in the military is exactly the same.
Follow-up to ethnic groups and military service: Readers asked some very fine questions about the earlier post. Here are the answers:
1. Mean score for Jews: .37 (about average)
2. West Indian IQ: the GSS does not have direct IQ data, but only 13% of all West Indians (ages 25-50) have completed at least a 4-year degree, compared to 26% of all Americans (in that age range).
3. Protestant vs. Catholic Irish: .42 for the former (above average, but not the highest) and .37 for the latter.
Monday, May 29, 2006
Colin Powell is not alone! West Indians serve the most in the military: On this Memorial Day, let's take a look at which American ethnic groups have devoted themselves the most to military service. Listed below is an index of length of time served among native-born Americans (0=no time, 1=less than 2 years, 2=2 to 4 years, 3=more than 4 years):
1.West Indians .86
2. French Canadians .51
3. Poles .50
4. Lithuanians .49
5. Scots .47
5. English/Welsh .47
7. Belgians .42
8. Germans .41
9. French .40
9. Austrians .40
U.S. average .39
11. Irish .38
11. Portuguese .38
13. Czechs .37
14. Finns .36
14. Norwegians .36
16. Swedes .35
17. Russians .34
17. Blacks .34
17. Mexicans .34
20. Dutch .33
20. Hungarians .33
20. Japanese .33
23. Italians .31
23. American Indian .31
25. Rumanians .30
26. Danes .27
26. Greeks .27
28. Chinese .25
29. Yugoslavs .22
29. Indian .22
31. Swiss .21
31. Spain .21
33. Puerto Ricans .06
Two Caribbean groups are on opposite ends of the scale here: the pathetic Puerto Ricans fall way below everyone else here, and they don't have the excuse of all going to college like, for example, Asian groups do. And the image of America not being able to defend itself without all those patriotic black and Mexican recruits is not borne out by these data: both groups fall below the American average, in spite of their low levels of education. (Of course, as Steve Sailer has documented so well, some of the problem here is low scores on entrance examinations).
Sunday, May 28, 2006
When it comes to the environment, Italian and Mexican immigrants are the worst: A reader asked how immigrants feel about the importance of protecting the environment. GSS respondents were asked about federal spending in this area, and the higher the average listed below, the more immigrant groups felt that we spend too much:
1. Scots 1.61
2. Italians 1.57
2. Other Asians 1.57
4. Mexicans 1.55
5. Filipinos 1.53
6. Russians 1.52
7. Chinese 1.49
8. Irish 1.49
Native-born 1.47
9. Puerto Ricans 1.46
10. Indians 1.43
11. Spain 1.40
12. Poles 1.38
13. English/Welsh 1.37
14. Germans 1.35
15. Africans 1.31
Overpopulation degrades the environment as well, so I looked to see which immigrant groups were having the highest mean number of children:
1. West Indians 2.45
2. Puerto Ricans 2.41
3. Mexicans 2.25
4. Italians 2.22
5. Filipinos 2.02
6. Spain 1.89
7. Greeks 1.88
8. Africans 1.87
9. English/Wales 1.83
10. Irish 1.74
11. Poles 1.73
12. Scots 1.69
13. French 1.65
14. Germans 1.64
15. Russians 1.59
16. Other Asians 1.47
17. Indians 1.26
18. Chinese 1.22
19. Arabs 1.10
20. Japanese .93
I then combined the rankings to come up with an overall ranking of the worst immigrants with respect to the environment. The final tally looks like this:
1. Italians 6
2. Mexicans 7
3. Filipinos 10
4. Puerto Ricans 11
5. Scots 13
6. Irish 18
7. Spain 17
8. Other Asians 18
9. Russians 21
10. English/Welsh 22
11. Poles 23
12. Africans 23
14. Chinese 25
15. Indians 27
16. Germans 28
Per capita, Italian immigrants are the worst, but if we were to look at the total impact, Mexicans would come in first since they are the largest group of immigrants by far. (And in an earlier post, I provided evidence that Italians are, on average, clean people while Mexicans are not.) Six out of 7 of the worst are Catholic groups, but Polish immigrants have few children and pro-environment attitudes. I wonder if some socially conservative immigrants are attracted to America and bring with them the desire to have large families.
Friday, May 26, 2006
Jews are not losing many of their own: One perennial concern in the Jewish community is that people are marrying non-Jews, leaving the faith, and are not raising their children to be Jewish. The GSS has some relevant data here. First, I looked at the children of marriages with either one or two Jewish parents. Here is the breakdown:
28 total children
25 had two Jewish parents and were still Jews as adults
1 had a Jewish mother and a Protestant father and grew up to be Jewish
1 had two Jewish parents and as an adult became a Protestant
1 had two Jewish parents and as an adult had no religion
Another question asks adults (in another sample) if they ever switched religions. For Jews, the numbers look like this:
10.1% switched to no religion
3.0% switched to Protestantism
1.6% switched to Catholicism
0.3% switched to Buddhism
0.9% switched to some other religion
As for intermarriage, I included all cases that involved any Jewish membership. In 26 cases, the person stayed Jewish:
20 people were raised Jewish, married a Jew, and remained Jewish
2 people were raised Jewish, married Catholics, but remained Jewish
1 person was raised as a Jew, married a Protestant, but remained Jewish
1 person was raised as a Jew, married someone from some other religion, but remained Jewish
2 people were raised Jewish, married someone with no religion, but remained Jewish
In three cases, a person switched from their Jewish upbringing:
1 person was raised a Jew, married a Protestant, but became a Buddhist
1 person was raised a Jew, married a Jew, but became Protestant
1 person was raised a Jew, married someone with no religion, and had no religion himself
But in 2 cases, non-Jews became Jewish:
1 person was raised Protestant, married a Jew, and became a Jew
1 person was raised with no religion, married a Jew, and became a Jew
And 10 others married Jews but did not become Jewish:
2 people were raised Protestant, married Jews, but remained Protestants
1 person was raised Protestant, married a Jew, and as an adult had no religion
4 people were raised Catholic, married a Jew, but remained Catholics
3 people were raised Catholic, married a Jew, and as an adult had no religion
So on the question of losing Jews, only 3 in this sample left the Jewish faith. Two of the 3 did not join the religion of their spouses, and the third switched to no religion (which was the same as the spouse). So three Jews were lost, but two were gained through intermarriage to Jews. I don't see much evidence that intermarriage is making Jews disappear. A very small percentage of Jews are switching to Christianity or Buddhism--more are lost to irreligion, and I imagine that many of these folks consider themselves to be Jewish in an ethnic sense. And as the top set of numbers show, 26 out of 28 children with at least one Jewish parent grew up to be Jews.
Ethnic groups and alcoholism: A reader asked about ethnic differences in alcohol abuse. In an earlier post, I summarized the GSS data on admitting to sometimes drinking too much:
Everybody knows that the Irish drink more than other Americans, right? (Curse you, you evil stereotypers.) Wrong, it's those sodden Swedes! The numbers are high among northern Europeans and go down as we move toward southern Europe. Asians are very low, as are Arabs. Blacks and Mexicans are in the middle. As for Puerto Ricans: if you take a tour of the Bacardi plant in San Juan, you will get to see the "Cathedral of Rum." And the Russians have really let me down here.
Everybody knows that the Irish drink more than other Americans, right? (Curse you, you evil stereotypers.) Wrong, it's those sodden Swedes! The numbers are high among northern Europeans and go down as we move toward southern Europe. Asians are very low, as are Arabs. Blacks and Mexicans are in the middle. As for Puerto Ricans: if you take a tour of the Bacardi plant in San Juan, you will get to see the "Cathedral of Rum." And the Russians have really let me down here.
By the way, I suspected that Russian Americans were low because half of them are Jews, but the non-Jewish Russians do not have high numbers either.
The GSS also asks if you have a drinking problem. Here is the percentage who answered "yes"(many ethnic groups were left out since their sample sizes are too small):
1. Germans 2.6%
2. Irish 2.5
3. Blacks 2.4
4. American Indians 2.2
5. Poles 2.0
6. Italians 1.8
7. Mexicans 1.1
8. English 0.7
Mexicans are the most race conscious, after blacks: The General Social Survey asks which social identity is most important to the respondent, then lists the following: current occupation, race/ethnicity, gender, age, religion, political party, nationality, family or marital status, social class, and region of the country. I was interested in how many Mexicans consider ethnicity to be their most important identity compared with other groups. Fifteen percent of blacks list this as being most important. For whites, it is 2 percent. For Mexican immigrants, it is 12%, and for native-borns of Mexican ancestry, it is 8%. Except for blacks, no ethnic group has numbers that high, whether we are looking at immigrants or those born in this country.
Wednesday, May 24, 2006
Mexican immigrants do not value American citizenship: An iSteve.com reader wrote that illegals don't want to be citizens, but "Mexicans with benefits." What do the data say? GSS respondents were asked how important is it to them to be an American citizen. Only one-third of Mexican immigrants said this was important. Almost twice as many immigrants from all the other countries felt this way (60%). Eighty percent of native-born Americans value their citizenship.
Monday, May 22, 2006
Comparing straights, gays, bi's, and lesbians: I was curious if various behaviors differ with sexual orientation. I found some interesting facts from the GSS:
Drinks too much
straight men 45.4%
bisexual men 83.3
gay men 48.1
straight women 31.5
bisexual women -- (sample too small)
lesbians 41.7
Gets mental health counseling
straight men 3.1%
bisexual men --
gay men 39.1
straight women 10.7
bisexual women --
lesbians --
Watches porn
straight men 34.9%
bisexual men 48.1
gay men 54.7
straight women 21.2
bisexual women 65.5
lesbians 33.7
Uses drugs
straight men 7.8
bisexual men --
gay men 39.1
straight women 2.6
bisexual women --
lesbians --
Unemployed
straight men 3.8%
bisexual men 13.6
gay men 2.7
straight women 2.3
bisexual women 5.9
lesbians 4.5
I picked these variables because it was my impression that bisexuals, gays, and lesbians have various sorts of trouble, and there is some evidence here to support that.
Sunday, May 21, 2006
Blacks were not always arrested in large numbers: It is widely believed that cops target blacks for arrest and have always done so. According to recent surveys, the percent of black men who have ever been arrested runs in the 30s. The General Social Survey can tell us what percent of black men who were young during the in the 1920s were arrested during that decade. I choose that period because KKK membership peaked at around 4 million members, and many cities were run by Klan leaders. If there was any time when black guys were unfairly arrested, it was then. So if it's 35% now, it must have been 75% then, right? Try 11 percent.
Who has the best respected jobs: men or women? How many years have we heard the bogus claim that women make less than men because of gender discrimination? Why have we never heard how men and women compare in terms of job prestige? A biased society might withhold lucrative jobs from people they dislike, but they would also deny positions of high status. According to the GSS, the prestige scores (ranging from 1-100) do not differ. For women, the average is 44.2, compared to 44.7 for men.
Jews do not think white Southerners have too much influence: A reader has suggested that, while Jews are not anti-Christian, they are in favor of Christianity have less influence in American society. The GSS does not ask about this, but it does ask if you think that southern whites have too much influence. While 12% percent of all Americans and 33% of blacks agree, only 9% of Jews do. Frankly, this low number surprises me since I figured that most Jews are liberals, and many liberals resent the influence of conservative Christians. But there it is.
Saturday, May 20, 2006
Nobody likes Muslims except for Catholics and Muslims: The General Social Survey asked Americans in 2004 about they felt about Muslims. Answering between zero to 50 indicated "cool," and 50-100 indicated "warm." Here are the means for people of various religions:
Warmth toward Muslims
Protestants 50.4
Catholics 54.4
Jewish 35.0
None 47.9
Muslims 83.3
So Catholics are the only group with a warm average. Protestants are neutral, Jews are clearly cold, and people with no religion are slightly cold. (I checked to see how coldly Muslims feel toward Jews--their average is 44.2.). Muslims feel warmer toward their own than any other religious group. (In a previous post, Jews and Catholics were around 80). Maybe this is why so few are outspoken against their terrorist co-religionists.
Are gays oppressed? We are told that America is a homophobic. Oliver Stone's "Alexander" tanked because we are disgusted by gay sex. Our hatred was shown in the reaction to "Brokeback Mountain." Well, if this were true, we would expect to see pervasive discrimination against homosexuals, and they would be forced into the lowest rungs of society. But my impression is that homosexuals do very well, at least in highly visible, creative fields--Broadway, Hollywood, and fashion. There seem to be many gay men and lesbians at high levels in my world (academia). And when I worked in health care, homosexuals apparently were doing well there too.
But let's move past impressions to data. According to the General Social Survey, the mean scores for job prestige (0-100), years of education, and 1998 income category (1-23) for men of different sexual orientations are as follows:
Job prestige
homosexuals 45.2
bisexuals 42.9
hetersexuals 44.5
Years of education
homosexuals 14.3
bisexuals 13.2
heterosexuals 13.6
1998 income bracket
homosexuals 16.3
bisexuals 13.6
hetersexuals 17.1
Gay men make a little less money than straight guys (17 means a household income of $35-40k), but they have more prestigious jobs. This suggests that gays are going into fields like education that are well-respected but don't pay particularly well.
And lesbians?
Job prestige
lesbians 43.9
bisexuals 40.2
heterosexuals 43.8
Education
lesbians 13.9
bisexuals 12.6
heterosexuals 13.4
1998 income bracket
lesbians 14.8
bisexuals 12.6
heterosexuals 16.1
We can see that lesbians have more prestigious jobs than straight women, and they are more educated. My guess is that their household incomes are lower because their partners are females who tend to make less money than would a husband.
And it is PC and naive to argue that we don't see evidence of discrimination because homosexuality is not skin color--bigots can't detect it. Perhaps not always, but of course they can. As I showed in an earlier post, many Americans think homosexuality is wrong, but the above numbers suggest that people are not going to hold it against you.
Thursday, May 18, 2006
Are Jews anti-Christian? Professor Kevin MacDonald has written that, "Jews were unique as an American immigrant group in their hostility toward American Christian culture and in their energetic, aggressive efforts to change that culture.” The GSS has data that is relevant here. Respondents were asked to give a score between 0 and 100 indicating how warmly they feel toward different religious groups. They were told that 0 to 50 is "cool" and 51 to 100 is "warm." (Many people said 50, presumably to indicate neutrality). I list below the average scores for different religious groups:
Toward Protestants
Protestants 73.7
Catholics 64.7
Jews 60.1
None 52.6
Toward Catholics
Protestants 62.8
Catholics 80.2
Jews 61.9
None 51.1
Toward Jews
Protestants 61.6
Catholics 64.4
Jews 79.9
None 51.1
These numbers show that all three religious groups have warm feelings towards
each other--people with no religion tend to be neutral towards Protestants, Catholics, and Jews. So, while Jews are less warm toward Christians than vice-versa, they still look at them more favorably than the irreligious do. There is no evidence here that Jews are anti-Christian. Incidentally, Catholics and Jews feel more warmly for their own than do Protestants.
God bless 'em: Women still dislike porn

Egalitarians claim that if men and women ever did have any differences in sexual interest, it was only the result of socialization. As men and women enjoy the same environments, their sexual urges will converge, we are told. Well, American men and women's experiences have converged in the last three decades, so have women caught up with men in their interest in porn? Not hardly. The graph above shows that the share of women who have watched a x-rated movie did not change from 1973 to 2004. They are no more interested in it now than 33 years ago. Based on this, I predict that women will never enjoy this form of entertainment as much a men. Never. Why? Because we're different.
Tuesday, May 16, 2006
Shazam! Being in school with blacks and Hispanics is scary: Steve Sailer corrected the interpretation of a study that concluded that racial diversity in school leads to a feeling of safety. I am familiar with data that contradict this idea. The Health Behavior in School-Aged Children is a large, nationally representative sample of children ages 11 to 18. They were asked how safe do they feel at school. If ethnic heterogeneity predicts feeling safe, we should find that whites are the most frightenened racial group since they attend the most homogeneous schools (i.e., mostly white). But we find just the opposite: whites are the most fear-free group. Listed below are the mean scores for feeling very safe:
Whites 3.99
Asians 3.70
American Indians 3.61
Hispanics 3.58
Pacific Islanders 3.54
Blacks 3.54
All minorities groups are more fearful than whites, and all minority groups are likely to attend mixed schools, especially Hispanics and blacks.
So, as usual, the facts are in direct contradiction to PC "theorizing." These stats show that students who are around the most dangerous kids (blacks and Hispanics) are the most afraid, and those who are around the least dangerous kids (whites and Asians) are the most comfortable. Occam's Razor, like Sailer says.
Mexicans love government: A reader suggested that I look to see if Mexican-Americans (MA) are liberal on goverment spending. I calculated the following numbers (using the GSS):
Very strongly agree that government should reduce income differences
Blacks 33%
MA 24%
All Americans 18%
Agree that government is right on track with concern about social welfare
Blacks 79%
MA 80%
All Americans 73%
Very strongly agree that government should help pay for medical care
Blacks 47%
MA 34%
All Americans 29%
Very strongly agree that government should improve our standard of living
Blacks 37%
MA 26%
All Americans 17%
Very strongly agree that government should do more
Blacks 31%
MA 24%
All Americans 14%
So it's true that Mexicans believe in government spending more than the general population. Blacks are notorious for believing that government is the answer to everything--MAs are somewhere between blacks and everyone else. It doesn't surprise me when poor groups look to government as the way up. What surprises me is when I see the love affair between wealthy groups and government (e.g., Jews and Chinese).
Monday, May 15, 2006
Mexicans are conservative on some issues: A reader noted that Mexican-Americans are social conservatives. I was curious to see the exact numbers on a few issues, social and otherwise, that are close to the liberal's heart. First, I looked at abortion. According to the GSS, while 41% of Americans are in favor of abortion for any reason, only 30% of Mexicans feel that way. Thirty-six percent of Americans favor spending more taxes to protect the environment, compared to 24% of Mexicans.
This group is also thought to be more homophobic than others, but there was only a one percentage point difference between those of Mexican ancestry and the general population who think there is nothing wrong with homosexuality (18 vs. 19%).
Feminists and environmentalists should think twice about favoring open borders. Greens should be doubly concerned since a flood a Mexicans also means environmental degradation through overpopulation. Perhaps people think that Mexicans can be brought around on these issues. In Mexico, abortion is legal only when the mother's life is at risk or in the case of rape, and only in the first trimester. If the Democratic party is increasingly swamped with Mexican members, I for one would be ecstatic to see it forced to move right on abortion.
Immigrants are liberal, and their kids move farther left: Mainstream Republicans face a conflict in that they love immigrants but hate liberals. The data show that many immigrants come here liberal and have children who become even more liberal. I calculated the mean conservative score for each immigrant group and listed them below. If the score is less than 4.12, this means the immigrants are more liberal than native-born Americans:
1. Arabic 3.63
2. Japanese 3.75
3. Russians 3.77
4. Indians 3.80
4. Africans 3.80
6. Puerto Ricans 3.93
7. Filipinos 3.98
8. French 4.00
9. Scots 4.02
10. Chinese 4.04
11.Germans 4.05
12. West Indians 4.07
13. English/Welsh 4.09
Mean score for native-born Americans 4.12
14. Polish 4.12
15. Italians 4.26
15. Spain 4.26
17. Mexicans 4.27
18. Irish 4.35
You can see that 13 of the 18 groups are more liberal than Americans. White immigrants from Catholic countries tend to be conservative. It might surprise you to see that Mexican immigrants are conservative, but this changes dramatically among Mexicans born here. This list below give conservative scores for the American born:
1. West Indians 3.50
2. Russians 3.70
3. Indians 3.73
4. Africans (Blacks) 3.77
5. Puerto Ricans 3.88
6. Mexicans 3.89
7. Chinese 3.90
8. Polish 3.96
9. Japanese 3.97
10. Italians 4.01
10. Spain 4.01
12. French 4.09
Mean score for native-born Americans 4.12
13. Irish 4.12
14. Germans 4.26
15. English/Welsh 4.31
16. Scots 4.32
17. Arabic 4.43
18. Filipinos 4.44
Republicans claim that immigrants may come here liberal, but as they assimilate, they will move right. Wrong. Looking at people born here, 12 out of 18 groups are more liberal than the average American. The only two conservative non-white groups are Filipinos and Arabs, and the latter group has that whole terrorism thing going against it.
So most groups end up liberal, but they came here liberal, so maybe they have moved right, but just not enough yet to make it to the conservative column. Wrong again. This list shows movement among immigrants: a positive number shows a right-ward movement between first generation immigrants and those born here, and a negative number indicates a move to the left.
1.Arabic +.80
2. Filipinos +.46
3. Scots +.30
4. English/Welsh +.22
4. Japanese +.22
6. Germans +.21
7. French +.09
8. Africans -.03
9. Puerto Ricans -.05
10. Russians -.07
10. Indians -.07
12. Polish -.16
13. Chinese -.14
14. Irish -.23
15. Italians -.25
16. Spain -.25
17. Mexicans -.38
18. West Indians -.57
Eleven out of 18 groups have gotten more liberal. And the largest immigrant group by far--Mexicans--made a huge move to the left. Evidently, Mexicans are not following the historical immigrant path of assimilation, but are opting for the black strategy of liberalism and group rights. And Republican elites want 'em to keep on comin'. And that little trick of using a guest worker program to keep them from being able to vote is not going to work long-term either. Sam Francis had it right in calling them the "Stupid Party."
Sunday, May 14, 2006
Black women, the best mothers? Since we honor mothers today (God bless 'em), I wanted to see what kinds of moms are the best. The GSS asks about knowing where your children are on the weekends. I looked at several factors (e.g., employment, income, education, marital status) and nothing seemed to make much of a difference. The one thing that surprised me was race:
Percent of mothers knowing where kid is on weekend at least most of the time
1. Blacks 87.5%
2. Whites 86.6
3. Hispanics 77.3
I've read other studies indicating that blacks supervise their children less than other groups. This made me curious about what the fathers said:
1. Whites 82.7%
2. Blacks 81.8
3. Hispanics 50.0
Now, it is common knowledge that a majority of black kids do not live with their fathers, so how can 82% of these dads know where the kids are all the time? These kinds of answers make me suspect that the validity of self-report studies is lower for blacks than for whites, perhaps because many blacks see a study as interrogation by the white world, and so there is a motivation to present a more positive face to the interviewer. For example, I'm familiar with a well-known study done by leading criminologists that asked adolescent males if they had ever been hauled in by the cops, and the answers were then compared with police reports. It was found that, while white boys were honest, black boys were giving false answers, and the authors concluded that delinquency responses from black male teens are invalid.
The white fathers' numbers are high too (I'm skeptical that fathers--black or white-know where their kids are better than Hispanic mothers) so it looks like there is a different standard being used here. The fathers probably feel they know where their kids are if they can tell you which town they are in.
Saturday, May 13, 2006
Wealth, education, and occupational prestige do not predict happiness, but a good family life does: I've listed below those factors that best predict feeling that your life is a very happy one (according to GSS data):
Correlations between various factors and personal happiness
1. Being happily married .48
2. Satisfied with family life .34
3. Satisifed with friendships .31
4. Satisified with one's health .27
5. One's overall health .25
6. Satisfied with job .22
7. Feeling that things are worthwhile .22
If people have high scores on all these predictors, about 90% of them are very happy. Indicators of social status--income, education, job prestige--are only weakly related to being happy. I hate to concede that any wisdom can be found in Hollywood, but the popular message that a guy should invest in family over career seems to make sense.
Compared to the past, twice as many single black women have a herd of kids: I looked at the GSS to see how common it is among different American ethnic groups to be a single mom with many kids. Limiting myself to only those groups with sufficiently large samples, the following groups had no never-married women with 4 or more children: French Canadian, Czech, English/Welsh, French, German, Irish, Italian, Dutch, Norwegian, Polish, Russian, Scottish, and Swedish. The following groups had a t least some women in this category:
Percent of never-married women with 4+ kids
1. Blacks 11.5%
2. Puerto Ricans 10.4
3. Mexians 3.2
4. American Indians 2.5
Blacks are a large enough group to examine over time, so I compared the 1970s with this decade. In the 1970s, 6.6% of never-married black women (NMBW)had 4 or more kids. Even though the trend among American women over the past few decades has been to have fewer children, in this decade the percent with 4+ kids for NMBW (12.8%) is double the rate seen in the 70s.
Friday, May 12, 2006
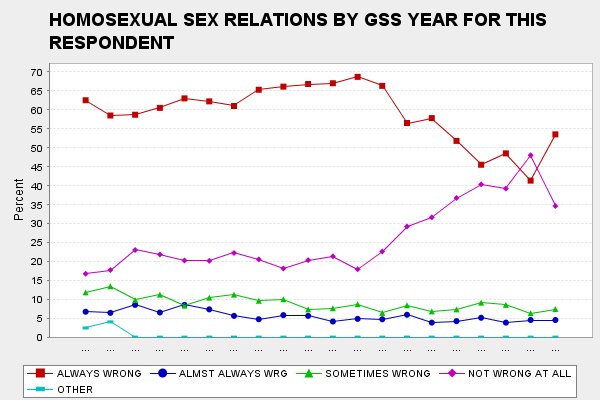
Whites have become much more accepting of homosexuality--blacks have not.
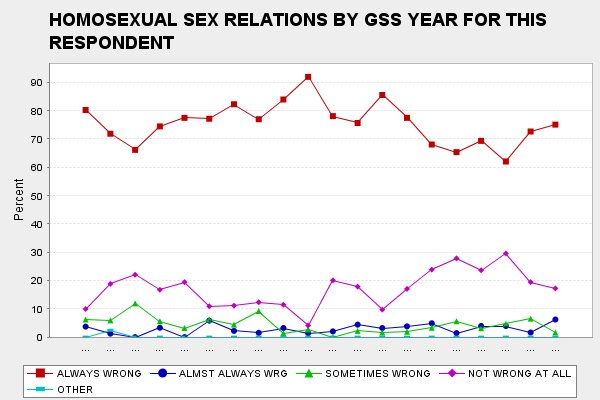
A gay reader of iSteve.com wrote about how blacks do not want to share a minority center at the University of Chicago with gay students. This got me interested in how much the trends in attitudes toward homosexuality differ between whites and blacks. The first graph above (1973-2004) shows that blacks' tolerance of homosexuality has not changed much in 30 years. The red line shows that the percent thinking that homosexuality is always wrong has hovered around 80%. Acceptance peaked in 1976 and 2000 (grey line) but at no time have 30% of blacks felt that being gay is okay.
By contrast, the second table shows that white acceptance rose significantly from the early 1990s until peaking in 2002 at 48%. Apparently, whites buy the whole idea of universal tolerance, while blacks believe in blacks.
Acceptance for both groups has dropped in the last couple years, perhaps as a reaction to the push for gay marriage.
Light-skinned blacks may be more anti-white: According to the GSS, more than 3 times as many light-skinned as compared to dark-complected blacks earn at least a bachelor's degree (28.6% vs. 8.1). (Do you think genes or environment is the better explanation, and why?)
So, all this education integrates light-skinned blacks and helps them identify with whites, right? No it doesn't. Eight percent of dark-skinned blacks said they trust most whites, but none of the light-skinned blacks agreed. While 27 percent of the dark group said they were politically conservative, only 14 percent of the light group identified themselves this way. Evidently, the racial authenticity of lighter blacks is in question, so they are more likely to prove their blackness through distancing themselves further from whites. Two famous examples come to mind. While the black-looking Martin Luther King Jr. reached out to whites, the light-skinned, red-headed Malcolm X was notoriously anti-white.
So, all this education integrates light-skinned blacks and helps them identify with whites, right? No it doesn't. Eight percent of dark-skinned blacks said they trust most whites, but none of the light-skinned blacks agreed. While 27 percent of the dark group said they were politically conservative, only 14 percent of the light group identified themselves this way. Evidently, the racial authenticity of lighter blacks is in question, so they are more likely to prove their blackness through distancing themselves further from whites. Two famous examples come to mind. While the black-looking Martin Luther King Jr. reached out to whites, the light-skinned, red-headed Malcolm X was notoriously anti-white.
American Muslims want the most kids: I looked at the GSS to find out what people consider to be the ideal family size. For all Americans, the mean is 2.5. By the way, the fact the average woman has fewer than 2 kids shows that people are not able to have as many kids as they would like. Presumably, this is because people feel they cannot afford them. (Of course, some people cannot have children). Comparing religious affiliations, Muslims want the most kids:
Mean number of children desired
1. Muslims 2.9
2. Catholics 2.6
3. Protestants 2.5
4. Jews 2.4
5. None 2.3
6. Buddhists 2.1
Not surprisingly, the desired number of children rises with conservatism. Roughly 40% of American Muslims are black: they want an average of 3.1 kids (compared to 2.8 for black Protestants). Muslims who say they are white only want 1.7 children: those saying their race is "other" want 3.0 children.
Wednesday, May 10, 2006
Blacks have the most gays and the fewest lesbians: I've listed below the percent of American women who say they are lesbians:
Percent of women who are lesbians
1. American Indians 3.0
2. Irish 2.4
3. Italians 1.9
4. English/Welsh 1.4
4. Germans 1.4
6. Scots 1.3
7. Jewish 1.2
8. Mexicans 1.0
8. Blacks 1.0
This pattern is very different from that of gay men, supporting the idea that homosexuality and lesbianism are two different phenomena. (Keep in mind that, while I limited my analysis to the largest groups--with at least 200 cases-- lesbianism is rare so the estimates are not especially reliable.) Mexicans follow the same pattern as blacks here, ranking at the top for gay men but at the bottom for lesbians. Also--there are more lesbian than gay American Indians. This is a reversal from the normal pattern. Comments?
Tuesday, May 09, 2006
Blacks have the most gay men: I thought it would be interesting to see if the prevalence of homosexuality varies by ethnic group. I listed the results from the GSS. (By the way, the GSS rate for all American men is 2.9%).
Percent of men who are gay
1. Blacks 4.4
2. Italians 3.5
2. Mexicans 3.5
4. English/Welsh 2.7
5. Germans 2.5
6. Irish 2.4
6. American Indians 2.4
8. Scots 1.2
So the prevalence among blacks is 3 times that of Scots. Now, the differences could be due to groups differing in their willingness to admit a homosexual orientation, but I would have guessed that the most macho groups (blacks, Mexicans, Italians) would have been the least willing to confess this. What's the explanation here? What do these three groups have in common that could produce a higher percentage of men saying they were gay? Perhaps paternal dominance? Males using sex to dominate other males? Effeminate males becoming gay through sexual experiences with these dominant guys? Prison experiences? More gays leading to a macho reaction? Genetic differences? Differences in viral infections?
Next, I'll take a look at lesbians.
Jews and classical music: According to anti-Semites, Jews work to undermine the best of Western culture. If this were true, wouldn't they be the first to entomb classical music? But just the opposite is true: the GSS tells us how many people really enjoy this kind of music, and no ethnic group likes it more than Jews:
1. Jews 36%
2. Scots 31
3. English/Welsh 23
3. Dutch 23
5. Germans 18
5. Irish 18
7. Italians 17
8. Blacks 12
8. Mexicans 12
10. American Indians 9
Our old immigrants loved Rossini. Our new ones love ranchera (I know--I'm punished with it as I search for NPR).
1. Jews 36%
2. Scots 31
3. English/Welsh 23
3. Dutch 23
5. Germans 18
5. Irish 18
7. Italians 17
8. Blacks 12
8. Mexicans 12
10. American Indians 9
Our old immigrants loved Rossini. Our new ones love ranchera (I know--I'm punished with it as I search for NPR).
Monday, May 08, 2006
More on race and self-image: Readers have indicated that blacks have high self-esteem. To put numbers on it, the Health Behavior in School-Aged Children asked kids if they have confidence in themselves. The following said "always":
Boys
1. Blacks 50%
2. American Indians 44
3. Hispanics 42
4. Whites 34
5. Asians 32
Girls
1. Blacks 45
2. American Indians 31
3. Hispanics 29
4. Whites 23
5. Asians 18
It's difficult for me to imagine any teenager never having moments of doubt, so there might be a little bit of posturing here, but these rankings are similar to the attractiveness rankings listed in the earlier post.
These findings match the research which shows that, despite the popularity of the idea, low self-esteem does not raise the risk of involvment in delinquency. The one thing that mugging someone does require is self-confidence.
You can imagine the thinking process here: We know that bad black behavior is caused by mean white people, but how do we fill in the blanks? Well, mean people like to tell you all the time that you are no good, and eventually you'll believe this, especially if these mean people are the ones with authority who run society. Once you become convinced that you're no good, you hate yourself and act self-destructively. There! We've filled in the story now. The one little problem is that this thinking doesn't draw the least bit on knowledge, experience, or known facts. It's simply a mental exercise that connects two things assumed to be true: blacks commit a lot of crimes and somehow whites are behind it. Then, after we've spend a lot of money to test this "theory" with research, the results just makes criminologists look foolish.
More on Jews: The question was raised about the beliefs of Russian-American Jews. GSS data indicates that 5% are atheists, 21% are agnostic, and the rest are believers. As for Russian Americans who have no religion, we don't know how many of them are of Jewish ancestry, but if any are, they chose to say "no religion" rather than "Jewish."
I was also curious about how the breakdown of the mother countries from which Jews have emigrated to the U.S.:
1. Russia 42%
2. Poland 15
3. Germany 9
4. Hungary 5
5. Rumania 3
5. England 3
7. Lithuania 2
7. Italy 2
9. Other European countries 5
So a clear plurality of American Jews are originally from Russia. We can say that in America many Russians are Jews, and many Jews are Russians. I'm surprised how few are from Germany.
Sunday, May 07, 2006
White kids watch the least television: The Health Behavior in School-Aged Children survey provides numbers of the total hours of TV watched per day. The racial differences are large:
Percent watching 4 or more hours a day:
1. Blacks 43%
2. Hispanics 24
3. American Indians 22
4. Asians 19
5. Whites 11
This pattern does not simply reflect a lack of money to do other things: American Indians are poorer than blacks but watch less TV. The television (also known as the "babysitter") is often the easy way out for parents, so these numbers might be a measure of parental presence and effort. I imagine that watching lots of TV reduces physical health and social interaction, increases mental passivity, and promotes a distorted view of reality.
By a landslide, blacks think they are beautiful: The survey of Health Behavior in School-Aged Children asked teens how good-looking did they consider themselves to be. I've broken down the percent who said "very good looking" by race:
Females
1. Blacks 34%
2. Asians 8
3. Mexicans 7
4. Whites 6
Males
1. Blacks 33
2. Mexicans 14
3. Asians 13
3. Whites 13
All other groups give similar numbers, but a much larger share of blacks think they are very attractive. I'm not sure if this reveals a black character trait or indoctrination that "black is beautiful," but it certainly does not reflect our mainstream culture's notion of what is most beautiful, nor does it reflect the objective reality of beauty (if there is such a thing). In fact, we see here an inverse relationship between the subjective and societal view of attractiveness: of all races and sexes, it is the white girl who is seen as the epitome of beauty, yet she of all groups thinks she is the least appealing. Perhaps these girls are a particularly insecure demographic, or perhaps people decide attractiveness vis-a-vis their sex-race group, and many white girls feel they simply can't compete with those white beauty queens.
Saturday, May 06, 2006
Mexican teens have the worst behavior: Everyone knows that, as a group, black teenagers behave worse than others, right? A great deal of thought is given to this troubling group. Well, evidently not enough thought is being given to the Mexican teenage problem. After all, it hasn't been blacks recently using politics as an excuse to skip school. Growing up, I went to school with blacks and Mexicans. Blacks were friendly--my best friend was black. My little brother and I never got into fights with people, but the one time that each of us did, it was with bullying Mexicans. The Health Behavior in School-Aged Children survey asked thousands of teens about bad behavior, and it turns out that Mexicans have the worst numbers:
Truant 4+ days last semester
White 10%
Black 12
Mexican 19
Marijuana use, weekly or more
White 7
Black 8
Mexican 9
Ever tried cocaine
White 5
Black 4
Mexican 10
Ever carry weapon
White 8
Black 12
Mexican 14
Bullies others
White 7
Black 15
Mexican 19
Frequent fighting
White 14
Black 17
Mexican 17
This romantic notion of Mexicans as model citizens must be dispelled.
The social construction of sexual harassment: If you work for a living, sooner or later you are going to be exposed to something sexual. The exposure may vary in content, frequency, or intensity, but it's going to happen, so I argue that sexual harassment is less about the particular work environment and much more about the woman. Let's see if the data back me up. The GSS asked women if they had ever been sexually harassed. Ninety percent of extremely liberal women with graduate degrees said they had been. And extremely conservative women who dropped out of high school? EIGHT percent. And don't tell me that it's liberal women who are the hotties who get all the attention. I only need give a very short list: Bella Abzug, Betty Friedan...Ann Coulter, Michelle Malkin.
Friday, May 05, 2006
Can people move up in America? In a sociology class I took, when the topic turned to occupational mobility, the professor told us there was no such thing in the U.S. Well, I now know that if a sociologist says something, bet the other way. According to the GSS, 25% of people whose father went no further than high school earned either a bachelor's or a graduate degree. But certainly nobody whose father was a high school dropout got anywhere, right? Wrong--11% completed a 4-year degree or more. If I confronted Mr. Sociologist with these facts, he would say that, yes, there is some movement, but the fact that the numbers are not bigger is due to nothing but unjust social restraints. But how well do children of high school dropouts do if they answer a challenging GSS reasoning-ability question correctly? Thirty percent of them get a bachelor's or graduate degree.
Older minority men still playuhs: I looked at the the number of sexual partners men between the ages of 30 and 60 have had in the last five years. I chose this age range because presumably guys have gotten past their wild 20s and are settling down into the kinds of long-term relationships that mature men and their children need. The percent of males having 11 or more sexual partners in the last 5 years is listed below:
Men
1. Blacks 10.9%
2. Mexicans 6.3
3. Italians 6.0
4. American Indians 4.6
5. English/Welsh 3.8
6. Germans 3.7
7. Irish 3.5
8. Scots 2.8
9. Poles 1.0
These results match the stereotypes: promiscuous minorities, reserved northern Europeans, and womanizing Latins.
Men
1. Blacks 10.9%
2. Mexicans 6.3
3. Italians 6.0
4. American Indians 4.6
5. English/Welsh 3.8
6. Germans 3.7
7. Irish 3.5
8. Scots 2.8
9. Poles 1.0
These results match the stereotypes: promiscuous minorities, reserved northern Europeans, and womanizing Latins.
Thursday, May 04, 2006
Disenchantment and disbelief lead to nihilism: What best predicts that a person feels that life serves no purpose? According to the General Social Survey, it is individuals who do not believe in God, do not feel at all close to Him, and who do not believe in miracles. Forty-eight percent of these people are nihilists, compared to only 5 percent of believers.
Current social conditions and dysgenic trends: Steve Sailer has written that ethnic groups react differently to the same social conditions. For example, while the harmful, unintended consequences of the liberal welfare state might be limited among Swedes, they have been pervasive among American blacks. Let's look and see if this is true for dysgenic fertility patterns. I calculated the mean number of children had by women with various characterstics who are ages 40 to 60, and I did this for both blacks and whites separately:
whites, less than high school 2.7
whites, graduate degree 1.6
ratio 1.69
blacks, less than high school 3.4
blacks, graduate degree 2.0
ratio 1.70
whites, low prestige job 2.3
whites, high prestige job 1.9
ratio 1.21
blacks, low prestige job 2.7
blacks, high prestige job 2.4
ratio 1.13
whites, not working 2.0
whites, full-time job 1.9
ratio 1.05
blacks, not working 2.7
blacks, full-time job 2.4
ratio 1.13
whites, poor health 1.8
whites, good health 2.1
ratio .86
blacks, bad health 2.5
blacks, good health 2.5
ratio 1.00
whites, mental illness 2.0
whites, no mental illness 2.1
ratio .95
blacks, mental illness 3.0
blacks, no mental illness 2.4
ratio 1.25
whites, IV drug use 1.8
whites, no IV drug use 2.0
ratio .90
blacks, IV drug use 3.4
blacks, no IV drug use 2.3
ratio 1.48
whites, arrested 2.8*
whites, never arrested 2.8
ratio 1.00
blacks, arrested 7.0
blacks, never arrested 3.0
ratio 2.33
First, black fertility is higher generally. As for the ratios, the more it is above one, the more dysgenic the trend. The more it falls below one, the more eugenic the trend. For education, the dysgenic trend is strong and the same for both groups. The negative trends are weaker for occupational prestige and unemployment, and the two groups are similar.
A difference in impact is more clearly seen with health factors. For overall health, whites enjoy a eugenic trend--blacks do not. The same is true for mental illness, and especially for IV drug use.
The difference is even more dramatic for crime. Whereas there is no dysgenic trend here for whites, there is a very large one for blacks.
So according to these data, the current welfare state we live is hurting the quality of white and black community roughly equally in terms of productivity. Uneducated, unemployed whites and blacks are out-reproducing their counterparts in roughly equal amounts. This situation is clearly different in the area of health and crime. Unhealthy blacks are out-reproducing healthy ones, while unhealthy whites do not have as many children as healthy whites. And while criminal and non-criminal whites have the same number of children, criminal blacks have more than twice as many.
These trends suggest a future of decreasingly productive but healthier whites on the one hand, but less productive, less healthy, and more criminal blacks, on the other hand.
*I had to use an older sample to analyze crime, so the fertility numbers are higher.
Wednesday, May 03, 2006
Are highly educated liberal women just about the most annoying people in the world, or what? I looked at the GSS to see how many women with graduate degrees and who describe themselves as extremely liberal are alone because no man can stand them. For ages 30 to 50, 32% of these women are divorced or separated and another 29% have never been married. So only a minority of these women have been able to find some sucker willing to marry or stay with them. (Of course, some of them have managed to find a willing female partner, though I can't imagine how they get along with each other.)
Who frequents prostitutes? Below is the percent of American men of various ethnic groups who say that they have paid for sex:
USA total 16.8%
1. Greeks 27.3
2. Russians 26.1
3. Blacks 24.8
4. Scots 23.5
5. Spain 20.0
6. Hungarians 19.4
7. Italians 19.3
8. Irish 18.1
9. Czechs 17.9
10. French Canadians 17.8
10. Other Canadians 17.8
12. English/Welsh 17.0
13. American Indians 15.3
14. Austrians 15.2
15. Japan 13.0
16. Dutch 12.9
17. Germans 12.8
18. Poles 12.5
19. Danes 10.5
20. Mexicans 10.0
21. Puerto Ricans 9.6
22. Filipinos 9.4
23. East Indians 7.5
24. Chinese 5.1
So, we would include in the high rate group: eastern and southern Europeans and blacks. Central and northern Europeans are in the middle, and Hispanics and Asians are at the bottom. Comments? This pattern does conform to the idea that blacks and whites have stronger sex drives than Asians. I'll post more on ethnicity and sexual behavior.
Tuesday, May 02, 2006
Who gets the blues? Whites are often portrayed as a group that suffers from depression--the alienated teenager, the unhappy housewife, the unsuccessful husband. The GSS shows something clearly different: I computed the percent of people who say they are frequently sad and down:
1. American Indians 16.9
2. Blacks 15.0
3. Mexicans 14.3
4. Jews 11.1
5. Italians 10.2
6. Irish 9.4
7. Germans 8.0
8. Poles 6.0
9. English/Welsh 5.6
10. Scots 2.4
There is a clear pattern of minorities feeling the most depressed. Comments?
1. American Indians 16.9
2. Blacks 15.0
3. Mexicans 14.3
4. Jews 11.1
5. Italians 10.2
6. Irish 9.4
7. Germans 8.0
8. Poles 6.0
9. English/Welsh 5.6
10. Scots 2.4
There is a clear pattern of minorities feeling the most depressed. Comments?
Which ethnic group in America keeps the cleanest house? GSS interviewers were ask to rate the cleanliness of the home they entered. Below is a breakdown of the percent of homes that were rated as very clean:
1. Italians 61.2%
2. Jews 58.9
3. Poles 58.5
4. Scots 57.6
5. English/Welsh 50.2
6. Irish 49.1
7. Germans 48.8
8. American Indians 39.4
9. Mexicans 38.8
10. Blacks 35.4
I've noticed that the bathrooms at the college (which is heavily Hispanic) are dirtier than other institutions where I have taught. There is a lot of garbage along the freeways of this city, and the two times I saw people chucking stuff out the window, they were Hispanic. Evidently, mass illegal immigration is making America less and less clean.
In America, which ethnic group is most ethnocentric? The General Social Survey asked respondents if they think about social and political issues as Americans or as members of an ethnic group. The obvious choice is blacks, right? Well yeah, there's no news there. Listed below are the percent who answered ethnic group:
1. Blacks 43.5%
2. Mexicans 21.9
3. Jews 15.8
4. Italians 12.0
5. American Indians 7.8
6. Irish 5.1
7. Scots 4.8
8. English/Welsh 2.5
9. Germans .9
With massive Mexican illegal immigration, we might be creating yet another nation within a nation. It surprises me that Jews and Italians are more ethnocentric than American Indians! But for most white groups, just about all sense of ethnicity has vanished.
Monday, May 01, 2006
I shopped and spent $137.56 today--did anyone beat me? I wish every day could be like today. As I traveled around the city, shopping and getting something eat, I couldn't detect the slightest sign of system disruption. The only difference was that the traffic was a little lighter, and the stores were a bit less crowded with short people speaking words I cannot understand. A few Mexican restaurants were closed, but there are too many of those anyway. At least in my city, the impact of the May Day protest was on the order of whispery flatulant.
Which American ethnic group is the angriest? We are told that black Americans are so violent because unjust treatment fills them with rage, which in turn gets taken out on convenient targets. But are they really that angry? The GSS asked respondents how many days per week do they feel anger at someone. I tabulated the share of those who say at least 5 days:
1. Italians 13.7%
2. Mexicans 11.2
3. Scots 9.3
4. Blacks 9.2
5. American Indians 8.3
6. Irish 6.9
7. Poles 6.2
8. Jews 6.0
9. Germans 5.6
10. English/Welsh 5.2
Scots outrank blacks here, but when was the last time you heard about a Scottish drive-by? "So what color rag does your gang fly?" "Uhhh...plaid."
The Italian numbers fit the Joe Pesci stereotype, but I thought Mexicans were those cute and gentle little guys selling flowers in the middle of the road?
Anyway, one more attempt to link bad black behavior to white racism gets a sock in the nose.
Are you one of those outlaws who thinks blacks aren't so swift? What kinds of (Hitler-loving) people are so wicked (and evil) to suspect that blacks (a race of four-eyed bookworms), as a group, might be less intelligent than other groups? The percentage of whites who crimethink this is broken down into categories (only high and low are listed):
Less than a high school 28%
Graduate degree 13
Extremely conservative 31
Extremely liberal 19
East South Central region 25
Mountain states 17
Ages 70+ 32%
Ages 18-30 16%
Combining categories, the group with the highest rate of heresy is made up of those not completing high school, who are very conservative, and are age 70 or over. Forty-eight percent of them uttered the four-letter word: "unintelligent." (Okay, 13 letters). Not surprisingly, the hippest group did not agree: only 12% of extremely liberal graduates with at least a 4-year degree who were between the ages of 25 and 40 slipped and made the very uncool mistake of being honest.
And an interesting pattern emerges here. The people most likely to feel that blacks are as intelligent or more intelligent than other groups are the people most under the influence of theory and least under the influence of experience. Young Utahns with heads full of Professor So-and-So's Such-and-Such have had little experience with African Americans, but are most inclined to think they are smart. Those 80 year old curmudgeons in Mississippi who have interacted with blacks their whole lives doubt this.
Subscribe to:
Posts (Atom)
Are gun owners mentally ill?
Some anti-gun people think owning a gun is a sign of some kind of mental abnormality. According to General Social Survey data, gun owners ...
